
The definitive guide to the US’ $40 trillion debt problem, and implications for investors.
Earlier this summer, the United States celebrated its 250th birthday, which gave Americans an opportunity to reflect on the extraordinary accomplishments that we have collectively achieved in a relatively short period of time.
For those of us who are career investors, we made note of another important, but less joyous, milestone that was passed this summer – the US government crossing $40 trillion in national debt for the first time (up from $8 trillion 20 years ago).
I get a lot of questions about this topic, rightfully so. This type of headline is not confidence inspiring for asset owners that are relying on long-term growth to meet their financial goals.
I am not here to dismiss the long-term impacts of a debt-burdened US government. It is a real issue that has not garnered any serious proposals to resolve to this point. However, as we discuss in the last section of this letter, there are viable investment strategies that allow investors to still generate returns while managing this risk carefully.
How we got here
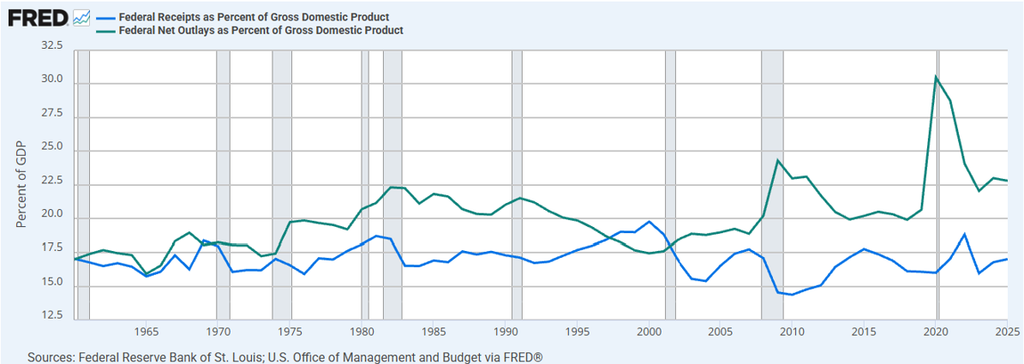
It is no mystery how we got here. Put simply, the US has dramatically increased its level of spending (green line in the below chart) while tax collections (blue line) have remained fairly steady.
In 1960, the US government spending level equated to roughly 17% of GDP, and tax collections also totaled around 17% of GDP, meaning the government ran a balanced budget.
Today, government spending has grown to almost 23% of GDP, while tax collections are still 17% of GDP. In other words, the US is running a budget deficit of roughly 6% of GDP.
There are two primary factors that have contributed to the growth in government spending – 1) crisis response spending, and 2) entitlements.
The US government has provided large amounts of stimulus to the economy during periods of crisis over the last 20 years (see the green line spike upwards during the 2008 Financial Crisis and COVID).
The COVID stimulus plan was particularly problematic for the US government finances. The $5 trillion in stimulus spending added $5 trillion to the US debt and created an inflationary impulse that led to higher interest rates.
For over a decade from 2008 through 2021, the US was running large budget deficits but was able to finance these deficits with low interest debt. However, the COVID stimulus plan injected $5 trillion into the US economy during a historic supply chain disruption. This led to the largest spike in inflation in 40 years, which in turn caused interest rates to increase by 4-5%. Higher interest rates mean the government has to spend more money on interest payments, making the problem worse.
While all of this crisis management spending was taking place, the US government has been dealing with a much larger problem that has been building over several decades – a secular rise in entitlement spending (i.e. Social Security and Medicare).
This is the primary cause of the US government’s spending problem. When Social Security was created in 1935, the average life expectancy for someone who reached retirement age (65) was roughly 78 years. In other words, the program was designed to support roughly 13 years of retirement for each beneficiary.
Today, the retirement age to collect full Social Security benefits is 67, and the average life expectancy for someone who reaches retirement age is roughly 85 years. Therefore, the same program must now support 18 years of retirement. These extra 5 years, which equate to an increase of 38%, have led to a severe deficit for the Social Security program.
On the Medicare side of the ledger, rising healthcare costs and an aging population have led to a similarly dire situation for the Medicare program. Just in the last 13 years, the number of Medicare enrollees has increased by 35%, and Medicare spending per beneficiary has tripled since 2000.
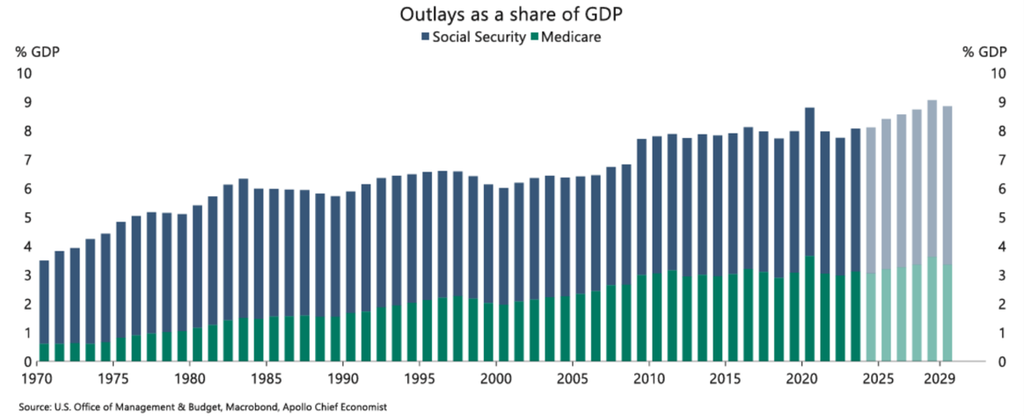
Combined, Social Security and Medicare spending has grown from less than 4% of GDP in 1970 to 8% of GDP today. Since the US is running a budget deficit of 6% of GDP, this means that 2/3 of the government’s deficit spending is attributable to the increase in Social Security and Medicare spending.
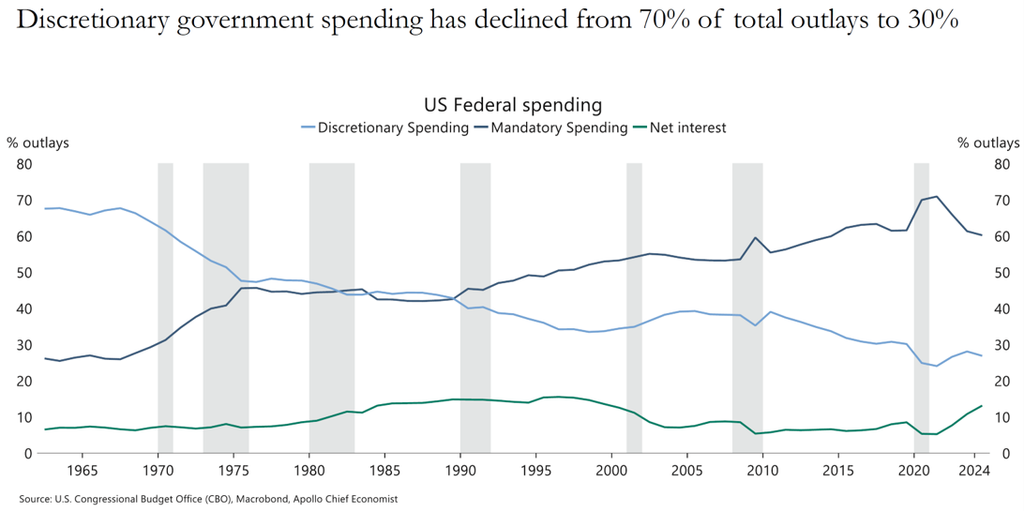
To further underscore – since 1960, mandatory spending (i.e. Social Security and Medicare) has grown from less than 30% of government spending to 60% today. Discretionary spending (which includes nearly all other categories, including military) has decreased from 70% of government spending to 26% today. And interest payments are steadily on the rise, now making up 14% of government spending.
Potential solutions
Many of the proposed solutions in the zeitgeist do not address the elephant in the room. Reigning in entitlement spending is a political third rail that most in Washington do not want to touch. While some point to wealth taxes as the solution, we would simply note that the total wealth of all US billionaires is $8 trillion, so even a 100% wealth tax on all billionaires would still leave the US with $32 trillion in debt. This is not a sustainable, needle moving solution.
Reducing the Social Security and Medicare deficits are the most surefire way to improve the US budget deficit. By reforming these two programs, the US budget deficit would decline, which would also cause interest rates to decline (a double benefit).
Potential reforms could include raising the retirement age (acknowledging the longer life expectancy today than when these programs were created), increasing payroll taxes, or more creative solutions (our preferred approach).
Under the creative category, it is perplexing that Americans and their employers pay 12.4% of income into Social Security, and yet that money is not invested thoughtfully to generate a reasonable rate of return. The Social Security Trust Fund is invested in special Treasury bonds that on average yield 2.6% (instead of the 10-12% returns generated by stocks over the last 90 years).
If money paid into Social Security was able to generate a higher rate of return by widening the menu of investments in the Trust Fund, the debt associated with the program would decline without cutting benefits or increasing taxes.
Similarly, creative solutions are required to resolve Medicare’s financial woes. Addressing the high cost of healthcare generally would have a more sustainable impact on Medicare than simply throwing more tax dollars at the problem.
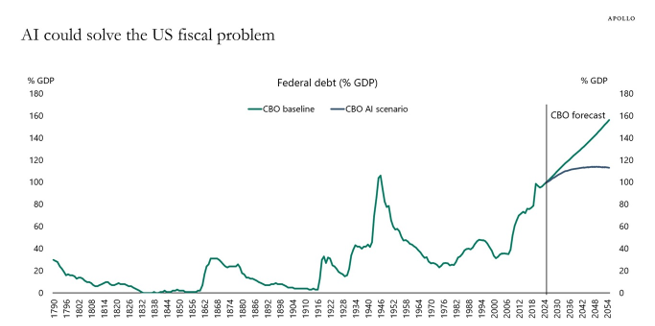
The other solution is faster GDP growth. If the economy grows faster than government spending, the deficit as a percent of GDP will shrink over time. As we’ve discussed in prior letters, AI is the primary driver of economic growth currently, and we would expect that GDP growth over the next 5-10 years will be closely linked to the AI buildout.
While this scenario may sound overly hopeful, the CBO has actually released data supporting the ability for AI to have a meaningfully positive impact on the trajectory of the Federal debt.
Source: Apollo Chief Economist, CBO
Investment implications
Given the fairly low likelihood of meaningful reform to Social Security and Medicare, investors must assume that the US government debt picture is unlikely to improve anytime soon (and as the last chart shows, it is on track to get worse).
After comments like this, I often get the follow up question of, “why are markets completely ignoring this?”
It’s true that the S&P 500 is hovering near all-time highs. However, markets have actually contemplated this issue pretty rationally to this point.
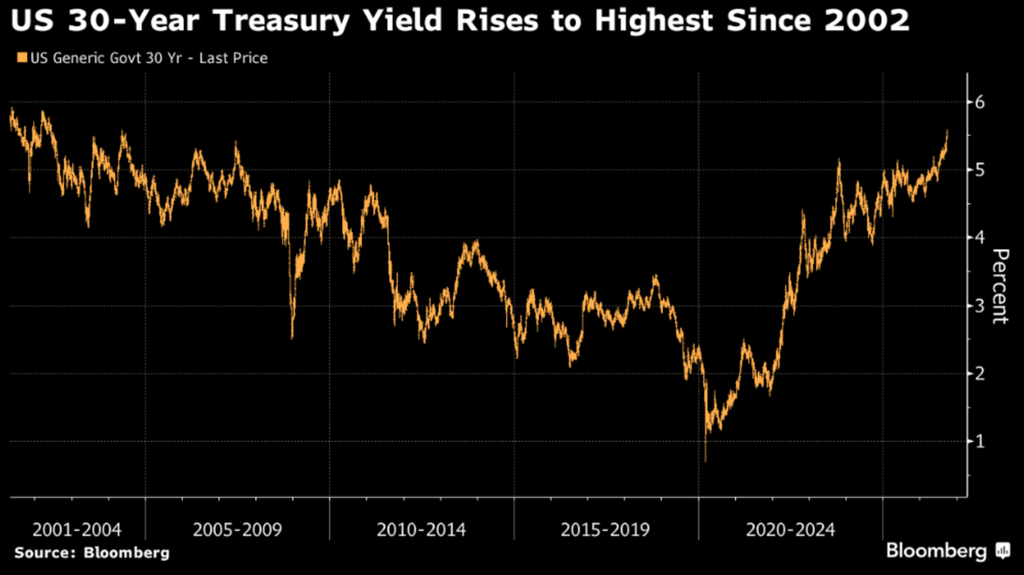
The most acute negative impact from the large US government deficit has been in Treasury bonds (and other fixed income assets). As the US issues more Treasury bonds to finance their deficits, supply of bonds increases which lowers their value. Also, if investors are concerned about the US government’s financial picture, they would not be buyers of long-term Treasuries.
Unfortunately, this has the potential for a vicious cycle. Higher deficits mean less investor demand for owning Treasuries, which in turn raises interest rates, and therefore increases the deficit further.
We see this in the below chart, which shows the yield on a 30-Year Treasury bond. As yields rise, prices fall (so owners of bonds would want the line to be declining, not rising). Said another way, the ETF that tracks long-term Treasuries (ticker TLT) has generated a -8% annualized return over the last 5 years (-35% cumulatively).
While bond investors have been suffering, equity investors have enjoyed a bull market for most of the 2020s so far. Since the start of 2020 (which was a few months before the COVID lockdowns began), the S&P 500 is up +155% cumulatively.
We would point to 2 reasons why the US debt picture has not disrupted the equity markets.
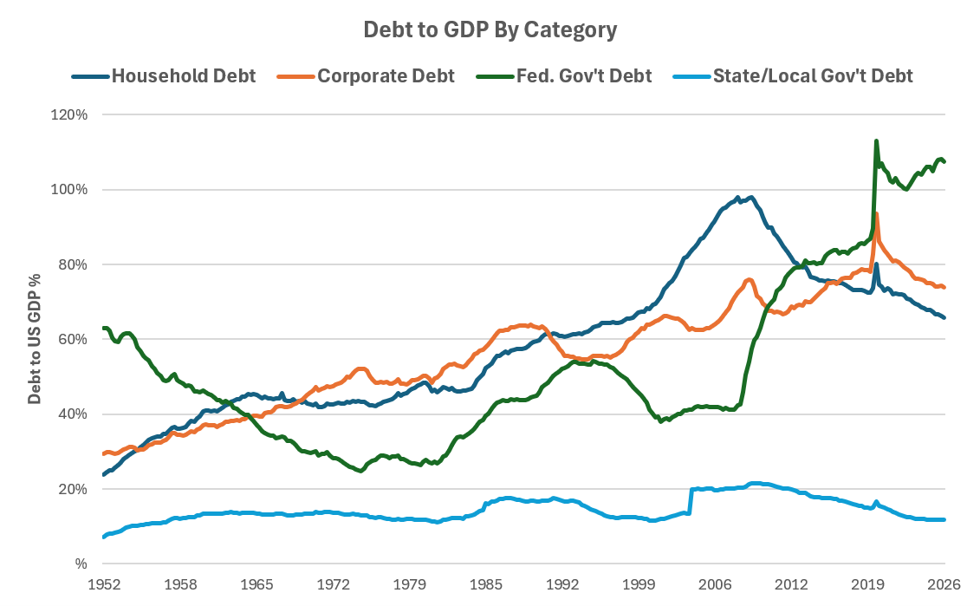
First, while government debt has been on the rise, household and corporate debt has declined meaningfully since COVID. Much of the COVID stimulus went directly to households and businesses which fortified their balance sheets. Additionally, many households and businesses took advantage of historically low interest rates in the early 2020s to refinance their debt and reduce interest payments.
In other words, while Washington has a debt problem, Corporate America and Main Street are in much better shape in aggregate (of course, not equally across all cohorts).
Source: The 1911 Trust Company, US Federal Reserve data
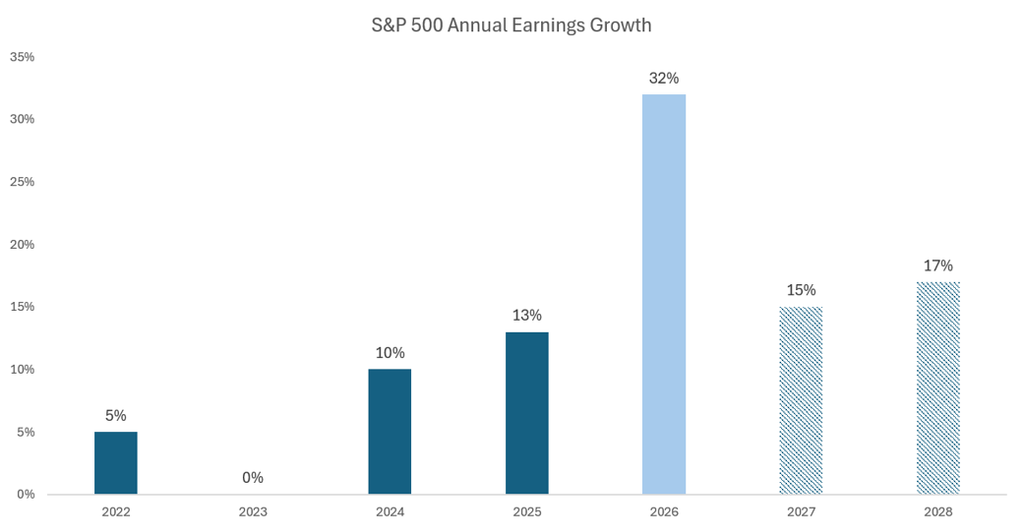
Second, the AI boom has turbocharged earnings growth for the S&P 500, a topic we have discussed at length in prior letters. As of this writing, earnings are expected to grow 32% in 2026. Early on in the post-COVID inflation shock, earnings growth was sluggish (and in some quarters negative). However, as the AI supercycle took hold, we have seen a meaningful inflection upward in earnings growth.
Source: The 1911 Trust Company, Factset
Our investment approach in the face of the US government debt overhang has been multifaceted.
First, avoid the eye of the storm and don’t own long-term Treasury bonds. Investors can get healthy yields in both municipal bonds, as well as shorter dated Treasury bonds where there is less risk and volatility. Owning small amounts of intermediate Treasury bonds (i.e. 5 year duration) is still viable as a recession hedge and liquidity source in a bear market (with a healthy 4.7% yield).
Second, continue to emphasize equities (both public and private) as the return engine for long-term portfolios. Within equities, the companies that are creating innovative products and services that can grow secularly are best positioned. This has led us to many of the market leaders in the AI ecosystem (both through venture capital as well as in the public markets) as well as high growth, high quality businesses with strong balance sheets. These areas of the market are less impacted by higher interest rates.
Third, invest in diversifying hedge fund strategies as a bond substitute. We have deployed meaningful capital into hedge funds that can make money by shorting Treasury bonds, buying commodities, and generating diversifying returns in other ways than by simply owning long-term Treasuries.
This playbook provides better protection than the traditional 60/40 portfolio (40% of which is at risk given the bear market in long-term Treasury bonds), and positions investors for higher returns.
